Blood Sugar Level Chart
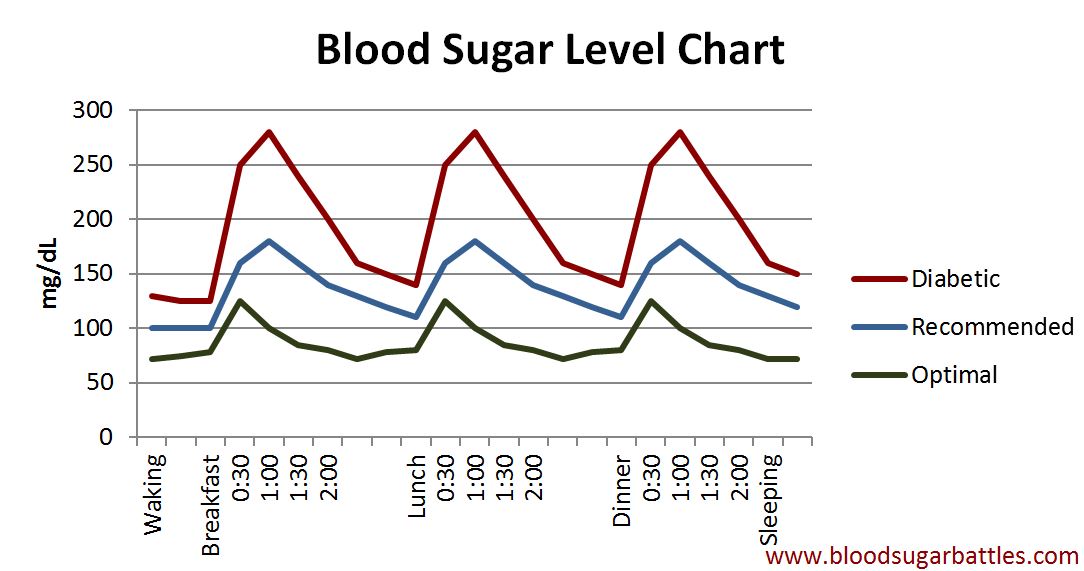
Our blood sugar level chart shows you at a glance the difference between healthy and diabetic blood glucose levels. So what do these numbers mean? The recommended blood sugar levels represented on this chart are a reflection of what the American Diabetes Association asserts is “normal”. Specifically:
- Fasting Plasma Glucose of less than 100 mg/dL
- Two-hour Oral Glucose Tolerance Test result of less than 140 mg/dL
Because there are several studies that show that the complications of diabetes can happen in individuals with blood glucose levels that are in this range(1), we looked to see if there are any studies that show what normal blood sugar levels are in people that have no history of blood sugar problems nor any complications that could be associated with blood sugar imbalances. As a result, the optimal blood sugar levels represented on this chart are those that were identified as being normal during Dr. J.S. Christiansen’s study, “Continuous Glucose Monitoring Data from Healthy Subjects” as presented at the September 2006 European Association for the Study of Diabetes.
What Does This Blood Sugar Level Chart Tell Us?
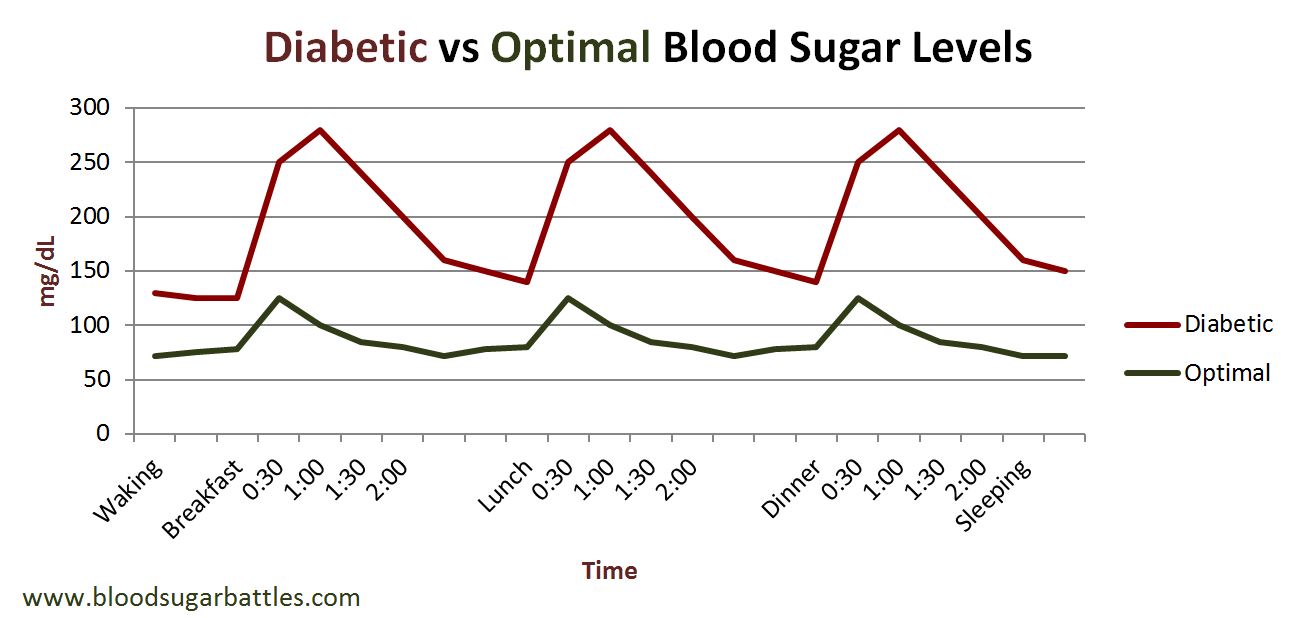
So what can you learn by comparing diabetic blood sugar levels with optimal blood sugar levels?
First, blood sugar fluctuates much less in people with healthy blood sugar levels. Where diabetic blood sugar levels fluctuate by 100 mg/dL or more, people with normal blood sugar have blood glucose fluctuations of 50 mg/dL or less. In addition, the folks with normal blood sugar started out with fasting blood sugar levels that are markedly less (72 mg/dL versus 130 mg/dL or more) than people with diabetes. Lastly, the blood sugar of normal subjects returned back down under 100 mg/dL very quickly after eating while diabetic blood sugar levels take much longer to fall after a meal.
What Causes the Difference Between the Diabetic and Optimal Blood Sugar Levels?
So what is going on that causes the difference between the diabetic and optimal blood glucose levels in the blood sugar level chart above? The difference represents a breakdown in the body’s ability to process sugar and simple carbohydrates.
High fasting blood sugar levels are an indication that the beta cells in your body that are responsible for producing insulin are having trouble keeping up with your body’s insulin requirements.
Blood glucose fluctuations are often indicative of insulin resistance, meaning that your body has to produce more and more insulin to process the sugar in your blood because the cells of your body are becoming less and less sensitive to insulin and therefore you need more of it before the cells of your body will open to receive glucose.
Slowly falling blood sugar levels are an indication that your beta cells are unable to manufacture and store enough insulin in the form of granules in between meals to bring your blood glucose back down to normal. Read more about how your body processes processes sugar and simple carbohydrates.
All of the above can be reversed by:
- Cutting your carbohydrate intake - therefore reducing the amount of sugar that gets released into your blood after a meal
- By exercising - to use the glucose already stored in your cells and to improve insulin sensitivity.
More Information
- Top 3 Symptoms of High Blood Sugar
- Normal Blood Sugar
- High Blood Sugar
- Low Blood Sugar
- Fasting Blood Sugar
References
(1) Increased Prevalence of Impaired Glucose Tolerance in Patients with Painful Sensory Neuropathy. Singleton, JR et al. Diabetes Care 24 (8) 1448-1453 2001
Like This Page?

Get FREE Book!
Limited Time Only
Click Here
Recent Articles
-
Symptoms Of Hypoglycemia
Jul 19, 17 11:07 AM
 Symptoms of hypoglycemia you should know about. When your blood glucose levels drop below normal levels,
 -
Diabetes Info
Jul 19, 17 10:57 AM
 Key diabetes info you should know about. Diabetes mellitus is a condition characterized by high blood sugar levels.
 -
Herbs For Diabetes
Jul 19, 17 10:48 AM
 Looking for herbs for diabetes? Many popular spices and herbs are claimed to have blood glucose lowering
© 2009-2017 BloodSugarBattles.com | All Rights Reserved
Terms of Use | Disclaimer | Privacy | Disclosures
The contents of this site are for informational purposes only. Always seek the advice of a qualified physician or health provider for medical diagnosis and treatment.
New! Facebook Comments
What do you think? Share your thoughts below...